


Show Us the Way: 10 Mapping Attributes That Can Help Utilities Effectively Serve Disadvantaged Customers
According to the White House, two-thirds of low-income U.S. households have high energy burdens, meaning they spend more than 6% of their income on utility bills. Utility customers who have a low income, are older adults, or who are from communities of color face numerous disadvantages in energy affordability. Well-designed energy efficiency programs that deliver cost-effective energy savings for low-income Americans can decrease utility bills by hundreds of dollars per year. These utility programs can also create new jobs, reduce pollution, improve public health, and promote equity. However, low-quality programs and low participation rates by eligible customers in disadvantaged communities mean these communities that can benefit the most from energy efficiency programs are falling behind in adopting cost-effective practices and receiving those benefits.
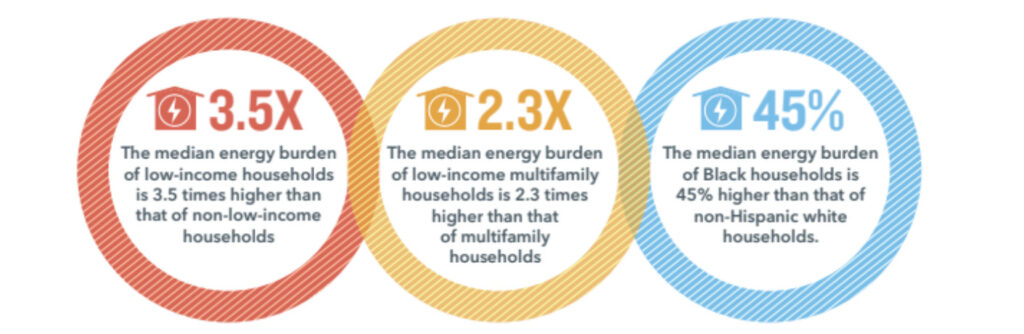
Source: ACEEE’s National and Regional Energy Burdens
Methodology
Through our work with utility clients across the nation, Cadmus has developed a method to view client programs through an equity lens that has yielded unique insights. To identify gaps in the historical delivery of service and highlight concentrations of eligible customers, our subject matter experts map households previously served by utility programs (such as utility-sponsored weatherization and/or bill assistance) and compare them to concentrations of income-eligible households throughout the utility’s service territory. To characterize disadvantaged populations and highlight areas with the highest need, we map distributions of eligible customers based on several demographic and housing characteristics that may signal a need for service and impact energy-saving potential. Using a scoring approach to rank geographies based on the distribution of eligible customers by each characteristic, we develop a composite score by all characteristics within each region to prioritize high-need areas.
Example Disability Characterization Map
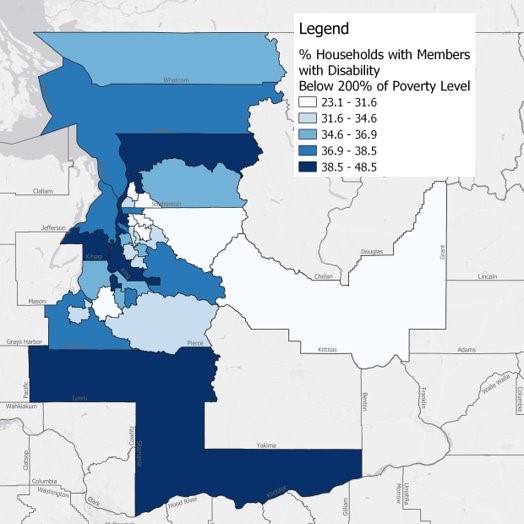
Source: Cadmus. Distribution of Eligible Households (200% FPL) by High Need Criteria – Disability. PSE Low-Income Household Needs Assessment
These geographic analyses use publicly available data to help utility clients offer customized solutions targeting their underserved customers while visualizing utility program progress toward goals.
Ten features that will take utility companies’ data to the next level
Through conducting these mapping exercises for utilities, Cadmus has found ten attributes that can help utility clients target communities of customers:
- Language Proficiency. Linguistically diverse neighborhoods often include a high concentration of communities representing many ethnicities, cultures, and traditions, including immigrant and English as a Second Language (ESL) populations. These communities may significantly benefit from customized resources to introduce utility programming. Mapping English-proficient households will identify where language barriers may exist within a utility’s territory and what languages to focus on for marketing and material development.
- Race/Ethnicity. ACEEE’s 2020 research found that low-income, Black, Hispanic, and Indigenous households all face dramatically higher energy burdens, which directly translates into spending a greater portion of their income on energy bills than the average household. Identifying where concentrations of non-white households are located within a territory may help utilities reach racial equity goals.
- Heating Fuel Source. In 2021, U.S. households that utilize natural gas for heating saw an increase in cost, up almost 30% on average when compared to 2020, according to the Winter Fuels Outlook 2021 report form the U.S. Energy Information Administration. Conversely, U.S. households that utilize electricity for heating experienced only a 6% increase on average when compared to 2020. A smaller number of households heat with propane or heating oil-5% and 4% of households, respectively-could see even bigger leaps in cost. According to the report, propane users will spend 54% more this winter, while heating oil users could see bills go up 43%. For utilities with electrification targets, mapping customers by heating source may help target communities prime for electric transition members while also offering positive net bill impacts for customers in need.
- Building Stock. Age and quality of single-family and multifamily building stock compound inefficiencies while presenting weatherization limitations and housing material performance. Mapping areas with older and larger homes may identify areas with a greater propensity for health and safety needs ahead of energy efficiency measures. Knowing which areas may have greater repair needs may encourage utilities to partner with community organizations to identify supplemental funding for remediation so that energy-saving impacts can be maximized.
- Vulnerability. Vulnerable populations such as disabled, elderly, or children may be sensitive to carrying a higher energy burden due to financial limitations. Mapping communities with a higher presence of these individuals may assist with leveraging program funds, since they overlap with attributes that the Department of Energy uses to prioritize weatherization service delivery, especially given the significant increase of federal LIHEAP funding.
- Government Assistance Recipients. Mapping where there are concentrations of participants enrolled in government assistance programs may indicate areas where households are already aware of assistance programs and may indicate a willingness to accept government support without stigma. Positive previous experiences with one program can influence customers’ participation in other programs and may make for targeted areas where households are predisposed to accept help from their utility to lower their energy bills.
- Income Eligibility Status. Although many utility weatherization programs target customers at 150% or 200% federal poverty level (FPL), some utilities may have goals to target customers in deep poverty (50% FPL) to make a greater impact on energy affordability. Likewise, some utilities may take an interest in moderate-income households and want to identify where households at 300% FPL are located.
- Public Health Indicators. Tracking health and safety metrics in the service territory may provide insights on populations that may be dependent on health devices or faced with other burdens (such as access to housing, health services, environmental quality, or maternal health). Targeting these households for improved indoor air quality through weatherization may increase the non-energy benefits that come from program participation.
- Efficiency vs. Equity. Comparing the aforementioned attributes by viewing the count of households versus percent of households with each characteristic can provide varying viewpoints to help a utility meet its goals. Identifying the percentage of households in a specific area can serve as an efficiency metric to reduce logistical burden in serving customers. Conversely, identifying the count of households in a specific area can serve as an equity metric to ensure households with specific characteristics in more populated areas do not get overlooked by program service.
- Air Quality. Poor and minority neighborhoods can bear the brunt of increased air pollution. Mapping the number of air pollution permits or approved air quality variances across a service territory can identify the overlap with a utility’s low-income population. These attributes may correlate with a need to increase weatherization services to outset environmental conditions and improve indoor air quality.
Knowing where to meet the people you want to serve is just the beginning. Constructing attractive programs that customers can relate to and find immediate value in with low barriers to access, methods to accelerate behavior change through education and awareness and the utility of road mapping future considerations and actions to be responsive to industry dynamics will start to bridge the gaps in communities. Connecting these various topics is essential to growing customers’ engagement and closing the energy affordability gap.
Authors: Jeana Swedenburg and Mitchell Lloyd